Restaurant Food Cost Percentage: Formula, Examples and Ways to Control It
Master restaurant food cost percentage with real formulas, a worked Indian rupee example, recipe costing standards, and practical methods to eliminate hidden kitchen waste.
Dineezy Team
13 Oct 2026 · 7 min read
On this page18 sections
- Why Food Cost Control Dictates Restaurant Survival
- What Is Food Cost Percentage and Why Does It Matter?
- The Standard Food Cost Percentage Formula
- Key Components Defined:
- Worked Example: A 30-Day Food Cost Audit (in Indian Rupees)
- Step 1: Calculate Actual Food Cost
- Step 2: Calculate Food Cost Percentage
- What Is an Ideal Restaurant Food Cost Percentage?
- Theoretical vs. Actual Food Cost: Finding the Hidden Leak
- Common Causes of Variance Leakage:
- How to Cost an Individual Menu Recipe
- Worked Recipe Example: Paneer Butter Masala (Portion for 2)
- 5 Practical Steps to Reduce Kitchen Food Cost
- Frequently Asked Questions
- How often should a restaurant calculate its food cost percentage?
- What is the difference between food cost percentage and gross profit margin?
- Should staff meals and customer comps be included in food cost?
- Protect Your Culinary Margins
Why Food Cost Control Dictates Restaurant Survival
In the restaurant industry, top-line revenue often creates a false sense of security. A restaurant can generate ₹20 Lakhs in monthly sales and still slide toward insolvency if ingredient expenses are unmanaged.
Food cost is typically a restaurant's single largest ongoing operating expense, competing only with rent and staff payroll. Yet many Indian restaurateurs only look at food expenses once a month when reviewing supplier bills—long after excess ingredient spend and kitchen wastage have eroded profit margins.
Understanding your Food Cost Percentage, tracking the difference between theoretical and actual usage, and enforcing recipe portion control are the foundational habits that separate thriving hospitality brands from struggling ones.
What Is Food Cost Percentage and Why Does It Matter?
Food Cost Percentage measures the proportion of total food revenue spent on purchasing raw ingredients used to prepare those dishes.
It provides immediate operational visibility into:
- Whether menu items are priced profitably.
- Whether kitchen staff are adhering to standardized portioning.
- How raw ingredient market inflation is impacting gross profit.
- Where hidden wastage, pilferage, or spoilage is draining kitchen margins.
The Standard Food Cost Percentage Formula
To calculate overall food cost across any given accounting period (weekly or monthly), use the standard Cost of Goods Sold (COGS) formula:
$$\text{Food Cost } = \text{Beginning Inventory} + \text{Purchases} - \text{Ending Inventory}$$
$$\text{Food Cost \%} = \left( \frac{\text{Food Cost}}{\text{Total Food Sales}} \right) \times 100$$
Key Components Defined:
- Beginning Inventory: The total monetary value of raw ingredients in stock at the start of the audit cycle.
- Purchases: The invoice value of all food supplies received during that period.
- Ending Inventory: The verified physical count value of ingredients remaining in storage at period close.
- Total Food Sales: Net food sales generated over the same duration (excluding beverage sales and GST).
Worked Example: A 30-Day Food Cost Audit (in Indian Rupees)
Let us examine a realistic scenario for a casual dining restaurant in India over a 30-day period:
- Beginning Food Inventory (Day 1): ₹1,80,000
- Raw Ingredient Purchases (Days 1–30): ₹4,50,000
- Ending Food Inventory (Day 30): ₹1,50,000
- Total Net Food Revenue: ₹14,00,000
Step 1: Calculate Actual Food Cost
$$\text{Food Cost} = ₹1,80,000 + ₹4,50,000 - ₹1,50,000 = ₹4,80,000$$
Step 2: Calculate Food Cost Percentage
$$\text{Food Cost \%} = \left( \frac{₹4,80,000}{₹14,00,000} \right) \times 100 = 34.28\%$$
In this scenario, raw ingredients represent 34.28% of every rupee earned from food sales.
What Is an Ideal Restaurant Food Cost Percentage?
There is no universal "ideal" percentage that applies equally to every concept. Healthy benchmarks vary significantly by operational format:
- Fast Food & QSR (Pizza, Burgers, Rolls): Typically 24% – 28% due to standardized prep, pre-portioned ingredients, and high volume.
- Casual Dining & Family Restaurants: Typically 28% – 34%, balancing fresh vegetables, dairy, poultry, and wider menu variety.
- Fine Dining & Premium Steakhouses/Seafood: Typically 34% – 40%, reflecting expensive proteins and artisan ingredients, offset by higher average bill values and higher beverage margins.
- Cafes & Beverage-Focused Outlets: Coffee and tea boast food costs of 12% – 18%, while bakery and food items average 26% – 32%.
Gross profit margin is the inverse of food cost ($100\% - \text{Food Cost \%}$). However, net profit margin only appears after subtracting fixed overheads such as rent, salaries, electricity, licensing, and aggregator commissions.
Theoretical vs. Actual Food Cost: Finding the Hidden Leak
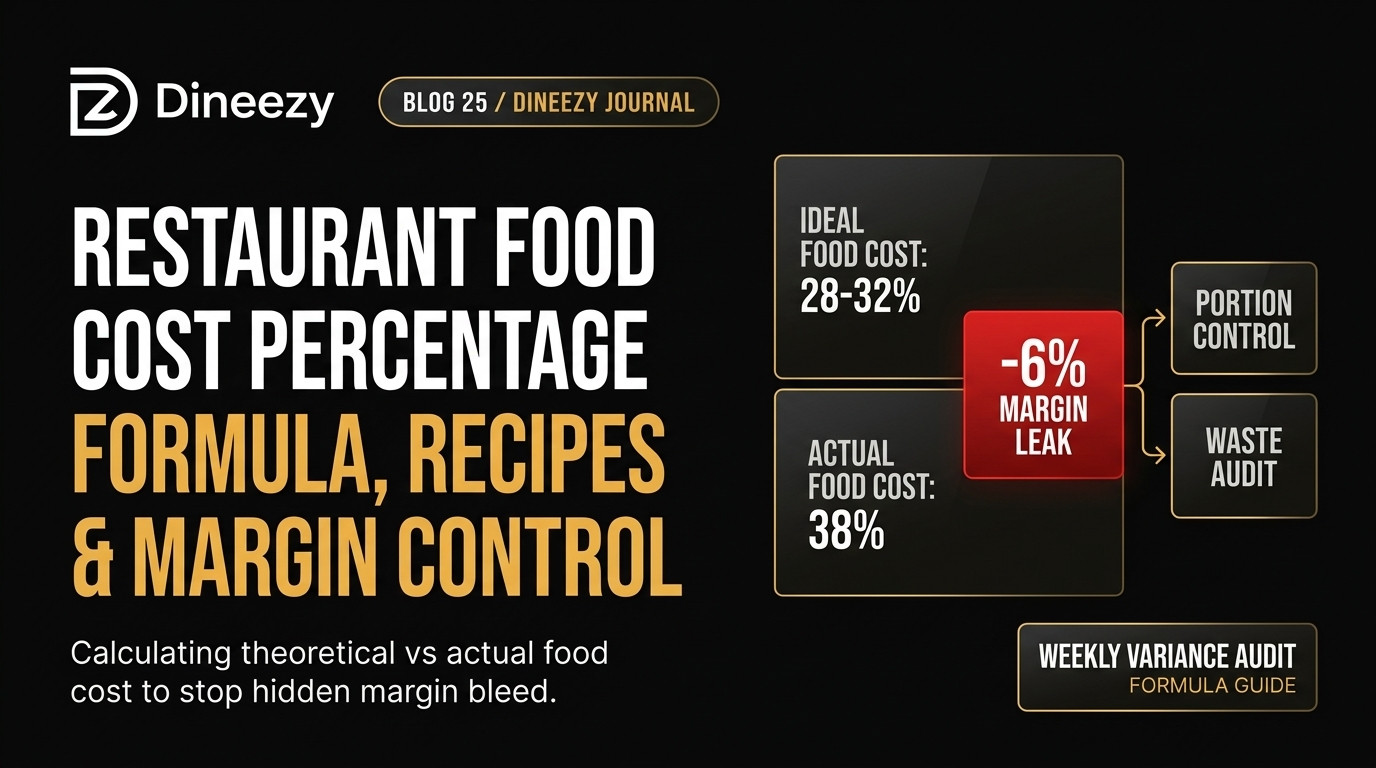
One of the most valuable operational exercises is measuring the Variance between what your food cost should have been versus what it actually was:
- Theoretical Food Cost: Calculated by multiplying the exact recipe cost of each sold dish (from POS sales logs) by the number of portions sold. If you sold 400 Butter Chicken portions with a recipe cost of ₹110 each, theoretical cost is ₹44,000.
- Actual Food Cost: The actual rupees spent on ingredients based on physical stock consumption.
- The Variance Gap: If theoretical cost was ₹44,000 but actual ingredient consumption was ₹52,000, you have an unrecorded ₹8,000 leakage gap (18.1%).
Common Causes of Variance Leakage:
1. Unmeasured Portioning: Kitchen staff eyeballing butter, cheese, or protein weights instead of using calibrated measuring ladles and digital scales.
2. Unrecorded Prep Waste: Over-trimming meats or vegetables discarded without logging waste sheets.
3. Mishandled Spoilage: Failure to observe First-In, First-Out (FIFO) stock rotation in cold storage walk-ins.
4. Pilferage & Unbilled Cooking: Staff cooking off-menu meals or dishes given to guests without generating a kitchen ticket.
How to Cost an Individual Menu Recipe
To set profitable selling prices, every single dish must have an itemized Recipe Cost Sheet.
Worked Recipe Example: Paneer Butter Masala (Portion for 2)
| Ingredient | Recipe Quantity | Unit Purchase Price | Ingredient Cost |
|---|---|---|---|
| Fresh Malai Paneer | 220 grams | ₹360 / kg | ₹79.20 |
| Makhani Gravy Base | 250 grams | ₹140 / kg | ₹35.00 |
| Amul Butter | 30 grams | ₹560 / kg | ₹16.80 |
| Cooking Cream | 25 ml | ₹220 / litre | ₹5.50 |
| Spices, Ginger-Garlic & Oil | Portioned batch | Lump sum estimate | ₹9.00 |
| Garnish (Coriander & Ginger) | Portioned batch | Lump sum estimate | ₹2.50 |
| Total Recipe Ingredient Cost | — | — | ₹148.00 |
If your target food cost percentage for this category is 30%, calculate menu selling price as:
$$\text{Selling Price} = \frac{\text{Recipe Cost}}{\text{Target Food Cost \%}} = \frac{₹148}{0.30} = ₹493.33$$
Rounding to a clean menu price of ₹495 or ₹499 achieves your target margin while maintaining clear market positioning.
5 Practical Steps to Reduce Kitchen Food Cost
1. Enforce Precision Portion Tools: Equip kitchen lines with portion scoops, measuring cups, and digital kitchen scales. A 20-gram over-portion of cheese across 100 pizzas daily wastes over 60 kg of cheese per month.
2. Conduct Weekly High-Value Audits: Do not wait for month-end to count stock. Audit your top 10 most expensive ingredients (paneer, chicken, mutton, ghee, exotic vegetables) every Monday morning.
3. Implement Digital Waste Logging: Require kitchen staff to log spoiled ingredients or burnt items before discarding them so patterns can be spotted early.
4. Negotiate Dual-Vendor Pricing: Avoid relying on single suppliers for core volume items. Split orders between two vetted vendors to maintain competitive pricing and guarantee supply continuity.
5. Connect POS Billing with Inventory Tracking: Utilize an integrated restaurant platform like Dineezy that syncs order sales with automatic recipe-level ingredient deductions to surface variance reports instantly.
Frequently Asked Questions
How often should a restaurant calculate its food cost percentage?
Weekly calculations provide the best operational control. Monthly audits are too slow to catch supplier price creep or portioning drifts before substantial profit has leaked.
What is the difference between food cost percentage and gross profit margin?
Food cost percentage measures ingredient cost relative to revenue. Gross profit margin is what remains after subtracting food cost from revenue. If food cost is 32%, gross profit margin is 68%.
Should staff meals and customer comps be included in food cost?
Staff meals and promotional tastings should be tracked separately as marketing or employee welfare expenses rather than blended into standard cost of goods sold.
Protect Your Culinary Margins
Cooking exceptional food is the heart of hospitality, but controlling recipe economics is the foundation of business longevity. By tracking food costs systematically, your kitchen team protects the hard-earned profitability of every plate served.
Discover Dineezy's Restaurant Operations Stack at dineezy.in/business to automate table ordering, kitchen communication, and financial visibility.
Dineezy Team
Author at Dineezy